colorplot3
algorithm
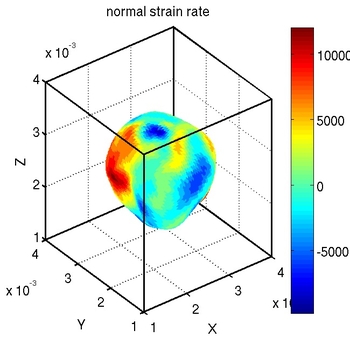
- plots values of a variable along an isosurface of another one
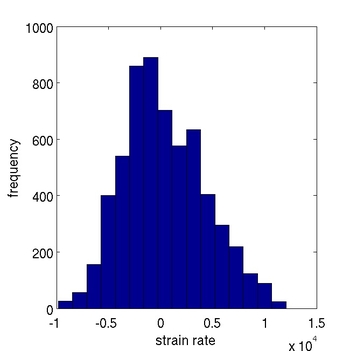
- plots corresponding histogram of the distribution
- note: do not use colorplot3 alone; colorplot3 runs in extract3


syntax
colorplot3(variso,vert,f,n)
example for input
colorplot3(variso,vert,f,16)
input arguments
|
variso |
values of a variable extracted from the isosurface of another one |
|
vert |
vertices of the isosurface |
|
f |
faces of the isosurface |
|
n |
number of colors and columns |
output arguments
|
plots |
colorplot, values on isosurface, |
matlab tools required
- patch, hist