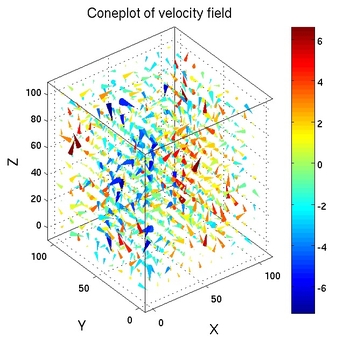
coneplot3
algorithm
- plots 3d velocity field as cones
- by default consider the whole domain
- optionally consider only a part of the domain

syntax
[]=coneplot3(XVEL,YVEL,ZVEL,X,Y,Z,L1,L2,C1,C2,P1,P2)
example for input
coneplot3(XVEL,YVEL,ZVEL,X,Y,Z)
input arguments
|
XVEL, YVEL, ZVEL |
matrices of the velocity components |
|
X, Y, Z |
vectors defining the rectangular domain |
|
L1,L2, |
integer values of gridpoints defining first and last line, |
output arguments
|
plot |
3d coneplot of velocity field |
matlab tools required
- coneplot