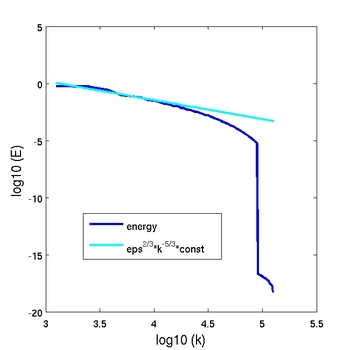
slope2
algorithm
- plots energy spectrum and slope of ekin

syntax
[]=slope2(k,tdiss,ENVP1,nx,ny)
example for input
[]=slope2(k,tdiss,ENVP1,401,401)
input arguments
| Name | description |
|---|---|
| k | wave number |
| tdiss | turbulent dissipation rate |
| ENVP1 | turbulent kinetic energy |
| nx,ny | number of points in x and y direction |
output arguments
| Name | description |
|---|---|
| plot | spectrum and slope of kinetic energy |
matlab tools required
toolbox tools required
corresponding 3d tools
- slope3