varstat
algorithm
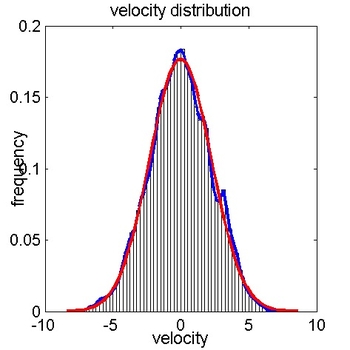
- calculates and plots histogram of distribution of variable1
- number of bars in histogram according to formula of Sturges;
- calculates and plots true pdf of distribution, pdf is based on 100 points
- calculates and plots gaussian pdf of distribution, pdf is based on 100 points,
- calculates mean value, standard deviation, skewness and kurtosis of distribution

syntax
[xpdf,fprob,fgauss,STATVAR]=varstat(variable1)
example for input
[xpdf,fprob,fgauss,STATVAR]=varstat(x_velocity)
input arguments
| Name | description |
|---|---|
| variable1 | variable to be considered, e.g. x_velocity matrix or vector |
output arguments
| Name | description |
|---|---|
| xpdf | intervals of histogram and pdf's |
| fprob | normalized frequency values of true pdf (area =1) |
| fgauss | values of gaussian pdf |
| SATVAR | mean value second order moment: standard deviation, third order moment: skewness, fourth order moment: kurtosis |
| plot | histogram and pdf of variable1 corresponding Gaussian pdf |
matlab tools required
- statistic toolbox