Post processing toolbox for 2d and 3d DNS and experimental results of turbulent reacting flows
Example for the investigation of a 2 dimensional non-premixed, turbulent H2/air flame.
-
load the data of the example flame "flame" in your workspace:
input: load flame -
First define and locate the flamefront:
-
e.g. along the stoichiometric isolevel of the mixture fraction Z at Z=0.5 between the upper boundary Z=0.9 and the lower boundary Z=0.1:
[og,ug]=flamefront (X,Y,Z,0.5,'abs',0.9,0.1);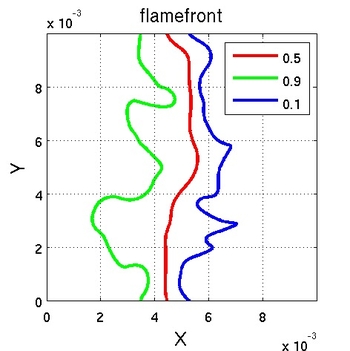
-
or along the crestline of temperature values
(higher than e.g. 60% of the maximum temperature)[CREST]=crestline (X,Y,temperature,0.6);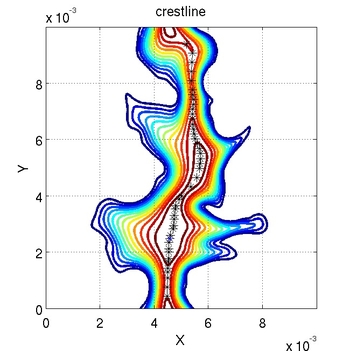
-
-
Second compute or extract important variables along the flamefront
-
e.g. extract the temperature along flamefront defined by Z=0.5;
input 'yes' to obtain the figure: [xiso,yiso,siso,tempiso,fp3]=extract (X,Y,Z,0.5,temperature,'abs','yes');
-
compute strainrate along flamefront:
[siso,strnff,meanstrn,strtff,meanstrt]= strainratelev (X,Y,x_velocity,y_velocity,Z,0.5,'abs'); -
compute strain rate in the whole field on order to prepare the extraction along linear or not linear cuts
[strn,strt]= strainrateall(X,Y,x_velocity,y_velocity,Z);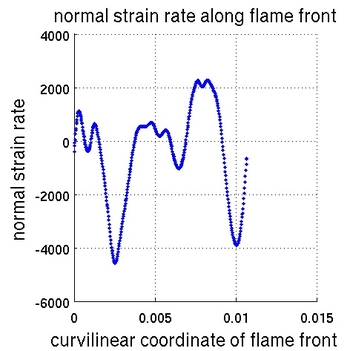
-
-
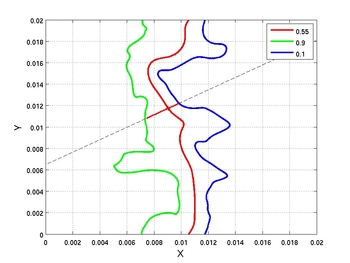
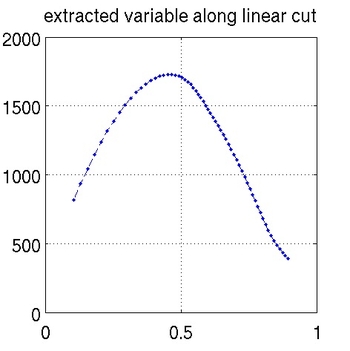
Then draw linear cuts through flame front between boundaries defined above
- extract variables for example temperature along these cuts
[XMIN,XMAX,YMIN,YMAX,XX1,YY1,VV1,VV2,VVG]=lincut (X,Y, 0.0055,0.005,0.9735,-0.2285,Z,temperature,0.00005,0.5,'abs',0.9,0.1);
-
compute integral value of temperature along the cut
intvar=intcutlin (X,Y,0.0055,0.005,0.9735,-0.2285,Z,temperature,0.00005,0.5,'abs',0.9,0.1); -
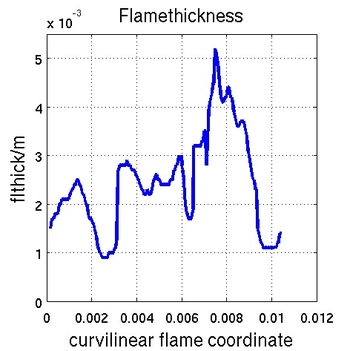
compute flamethickness along linear cuts, use batch modus
[sisok,flthick,maxfl,minfl,meanfl]=flamethicklinb (X,Y,Z,0.5,'abs',0.9,0.1);
-
Then draw nonlinear cuts through the flame front
[XMIN,XMAX,YMIN,YMAX,XX1,YY1,VV1,VV2,VVG]=nonlincut (X,Y,0.0046,0.0034,Z,strn,0.00005,0.5,'abs',0.9,0.1);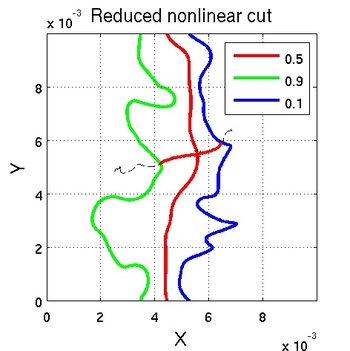
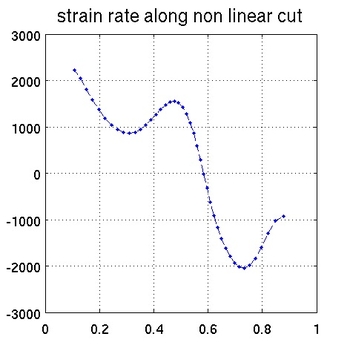
- extract variables for example strain rate along the cuts
-
Then do some statistical investigation
-
plot correlation between extracted variables of interest, e.g. flamethickness and strain rate:
correlationgen(flthick, strnff)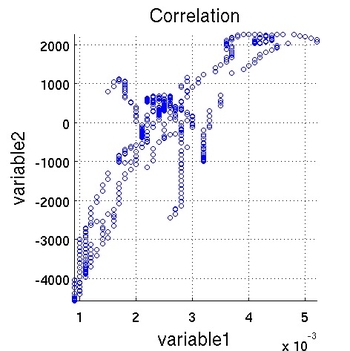
-
compute mean and rms values of variable e.g. temperature conditioned on Z
[v,m,rms]=condmeanfilt2 (X,Y,Z,temperature,0.01)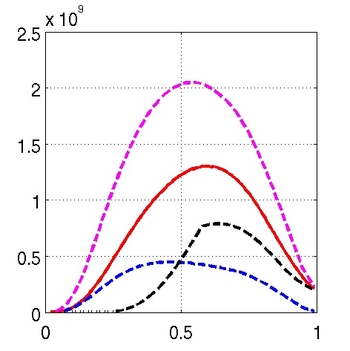
-
if you have statistics toolbox compute moments and pdf of for example velocity distribution
[STATVAR]=varstat(x_velocity)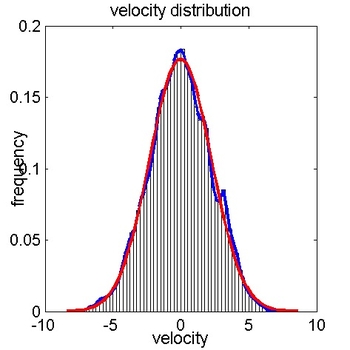
-
Investigate the velocity field
streamsliceplot2 (x_velocity,y_velocity,X,Y)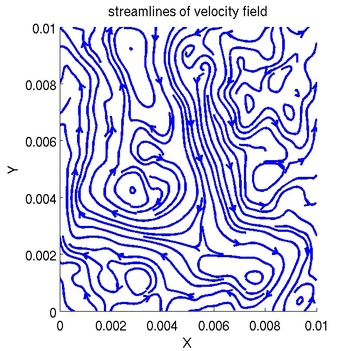
-


